Phlebotomist Salary in Vermont: $47,505 (2026)
Quick Answer:Across Vermont's 9 metropolitan areas, the average median phlebotomist pay sits at $47,505/year heading into 2026 — a figure projected from 2025 BLS OEWS wage data for SOC 31-9097. Because Vermont sits at BEA RPP 103.5 (4% above the U.S. baseline), that statewide median translates to roughly $45,899 in nationally-comparable purchasing power. Highest-paying metros: South Burlington ($46,234), Burlington ($46,000), Bennington ($44,858).
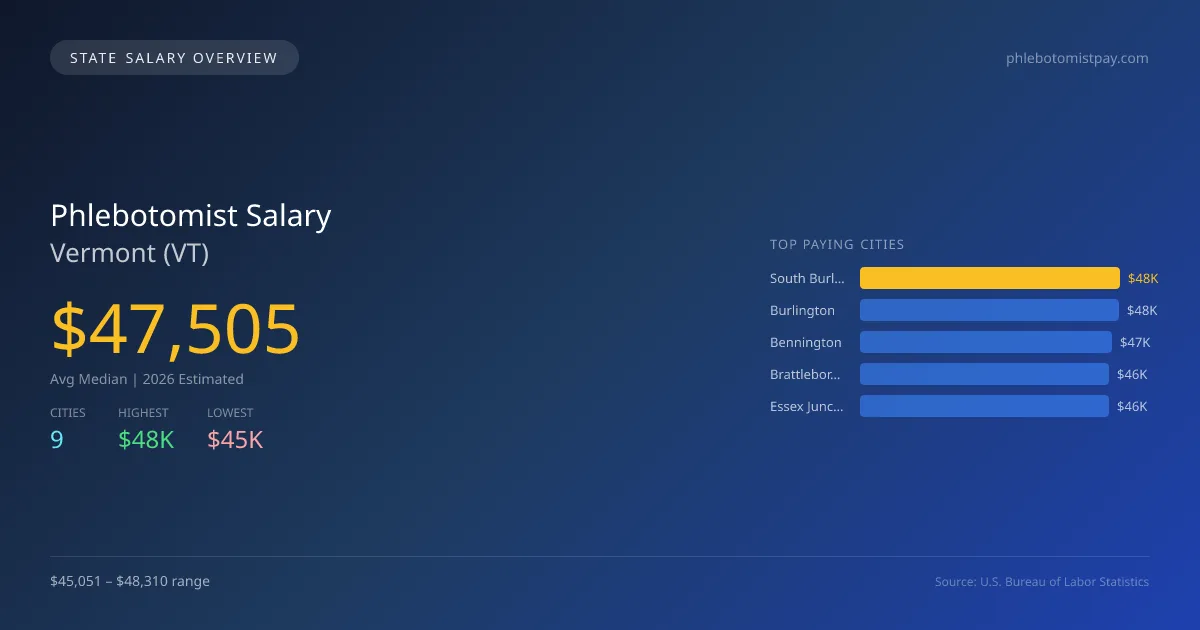
For those considering a career as a phlebotomist in Vermont, the projected average median salary in 2026 is $47,504, which is slightly above the national median of $47,261, marking a difference of +0.5%. There is a noticeable disparity between cities; South Burlington offers the highest salary at $48,310, while Montpelier presents the lowest at $45,051, a gap of $2,259. This variance can be attributed to factors such as cost of living, local healthcare facility demand, and job competition in urban versus rural areas. Vermont has specific state licensing requirements that phlebotomists must adhere to, which include completing an accredited training program and passing a certification exam. The scope of practice laws also delineate tasks that phlebotomists can perform, impacting job responsibilities and potential earnings. The demand for phlebotomists is expected to grow at an annual rate of 4.49%, signaling a positive job market outlook. Predicted salaries in other cities for 2026 include Burlington at $48,065, Bennington at $46,872, Brattleboro at $46,342, and Essex Junction at $46,243. A total of 130 phlebotomists are employed in the state, contributing to the overall healthcare workforce.
Vermont Phlebotomist Salary Range
Overall salary range in Vermont: $37,420 (lowest entry-level) to $61,607 (highest top earner)
Vermont vs National Average
Vermont phlebotomists earn 0.52% more than the national median (+$244/year difference).
Vermont Phlebotomist Salary Distribution (2026)
Phlebotomist salaries in Vermont range from $45,075 (entry-level, 10th percentile) to $60,079 (top earners, 90th percentile), with a median of $47,505. The Vermont median is $244 above the US national median of $47,261. The average hourly rate is $22.84/hr. Approximately 130 phlebotomists are employed across 9 cities.
2019 BLS Actual
$30,880
2025 BLS Actual
$45,463
2026 Current Est.
$47,505
2019–2027 Growth
+60.7%
Salary Trajectory for Phlebotomists in Vermont (2019–2027)
2019–2025: actual BLS OEWS data for this metro area. 2026+: CAGR 4.49% projection.
| Year | Annual Salary | Status |
|---|---|---|
| 2019 | $30,880 | Actual |
| 2020 | $31,610 | Actual |
| 2021 | $36,590 | Actual |
| 2022 | $34,960 | Actual |
| 2023 | $37,970 | Actual |
| 2024 | $41,071 | Actual |
| 2025 | $45,463 | Actual |
| 2026(current) | $47,505 | Estimated |
| 2027 | $49,638 | Projected |
Based on 7 years of BLS OEWS data for the Vermont metropolitan area, the median phlebotomist salary grew 47.2% from $30,880 (2019) to $45,463 (2025). At a 4.49% compound annual growth rate, salaries are projected to reach $49,638 by 2027 — a total increase of $18,758 (60.74%) from 2019.
Note: Historical values (2019–2025) are actual BLS OEWS figures for the Vermont metropolitan area, sourced from annual Occupational Employment and Wage Statistics surveys. 2026–2026 figures are current estimates, and 2027 values are projections, calculated using a 4.49% CAGR derived from 7-year BLS historical data. Actual salaries may vary based on employer, experience, certifications, and local market conditions.
Top 5 Highest Paying Cities in Vermont
Lowest Paying Cities in Vermont
| City | Median Salary |
|---|---|
| Montpelier | $45,051 |
| Colchester | $45,280 |
| Rutland | $45,331 |
| Barre | $46,180 |
| Essex Junction | $46,243 |
Best Value Cities for Phlebotomists in Vermont
When adjusted for local cost of living, these Vermont cities offer the most purchasing power for phlebotomists.
| City | Nominal Salary | CoL Index | Adjusted Salary |
|---|---|---|---|
| Burlington | $48,065 | 100.949 | $47,613 |
| South Burlington | $48,310 | 103.5 | $46,676 |
| Bennington | $46,872 | 103.5 | $45,287 |
| Brattleboro | $46,342 | 103.5 | $44,775 |
| Essex Junction | $46,243 | 103.5 | $44,679 |
Adjusted salary = nominal salary × (100 / CoL index). CoL index: 100 = national average. Lower index = lower cost of living.
Salary by Experience Level in Vermont
| Experience Level | Estimated Annual |
|---|---|
| Entry Level (0-2 years) | $45,075 |
| Mid Career (3-7 years) | $47,505 |
| Experienced (7+ years) | $60,079 |
Estimates based on BLS percentile data averaged across Vermont metro areas. Individual pay varies by employer, certifications, and specialization.
All 9 Cities in Vermont
| # | City | Median Salary |
|---|---|---|
| 1 | South Burlington | $48,310 |
| 2 | Burlington | $48,065 |
| 3 | Bennington | $46,872 |
| 4 | Brattleboro | $46,342 |
| 5 | Essex Junction | $46,243 |
| 6 | Barre | $46,180 |
| 7 | Rutland | $45,331 |
| 8 | Colchester | $45,280 |
| 9 | Montpelier | $45,051 |
More Vermont Salary Data
Hourly Rates
Explore phlebotomist hourly pay in Vermont cities.
Senior / Experienced
Top earner salaries for experienced phlebotomists.
Explore More Phlebotomist Salary Data
Frequently Asked Questions
How much do phlebotomists make in Vermont in 2026?
What is the highest paying city for phlebotomists in Vermont?
How does Vermont phlebotomist pay compare to the national average?
What is the entry-level phlebotomist salary in Vermont?
How many phlebotomists are employed in Vermont?
Which Vermont city offers the best value for phlebotomists?
Written by Aisha Patel, MLT
Career Analyst
Aisha has over 10 years of experience in clinical laboratory technology. She specializes in blood collection and processing. She works in a large urban hospital.
Methodology & Data Source
Statewide salary figures on this page are 2026 projections based on the Bureau of Labor Statistics Occupational Employment and Wage Statistics (OEWS) survey, May 2026 release. A 4.49% compound annual growth rate (CAGR), derived from 6-year national BLS wage trends, was applied to each metro area's reported salary to estimate current 2026 phlebotomist compensation across Vermont. State averages are employment-weighted across 9 metro areas — larger metro areas with more phlebotomistscontribute proportionally more to the average, producing figures that better reflect typical compensation. Individual pay varies by city, employer, certifications, and experience.
Data Sources & Methodology
Source: BLS, OEWS, 7-year dataset (–). Per-city data from annual BLS metropolitan area surveys.
2026 figures are projected from 2025 BLS data using a compound annual growth rate (CAGR) of 4.49%, derived from historical BLS wage trends for phlebotomists (SOC 31-9097).
Compiled and verified by Aisha Patel, MLT, a licensed phlebotomist with 10+ years of clinical experience. · View source data at BLS.gov