Phlebotomist Salary in Rockford, IL: $46,059 (2026)
Quick Answer:A full-time phlebotomist in Rockford, IL earns a median $46,059/year (≈ $22.14/hour) in nominal terms for 2026 — projected from BLS OEWS 2025 (SOC 31-9097). Once you factor in Rockford's price level (8% below national, BEA RPP 92.2), that paycheck buys what $49,980 would nationally. Nominal pay sits 0.1% above the Illinois state average.
Official BLS data · View source
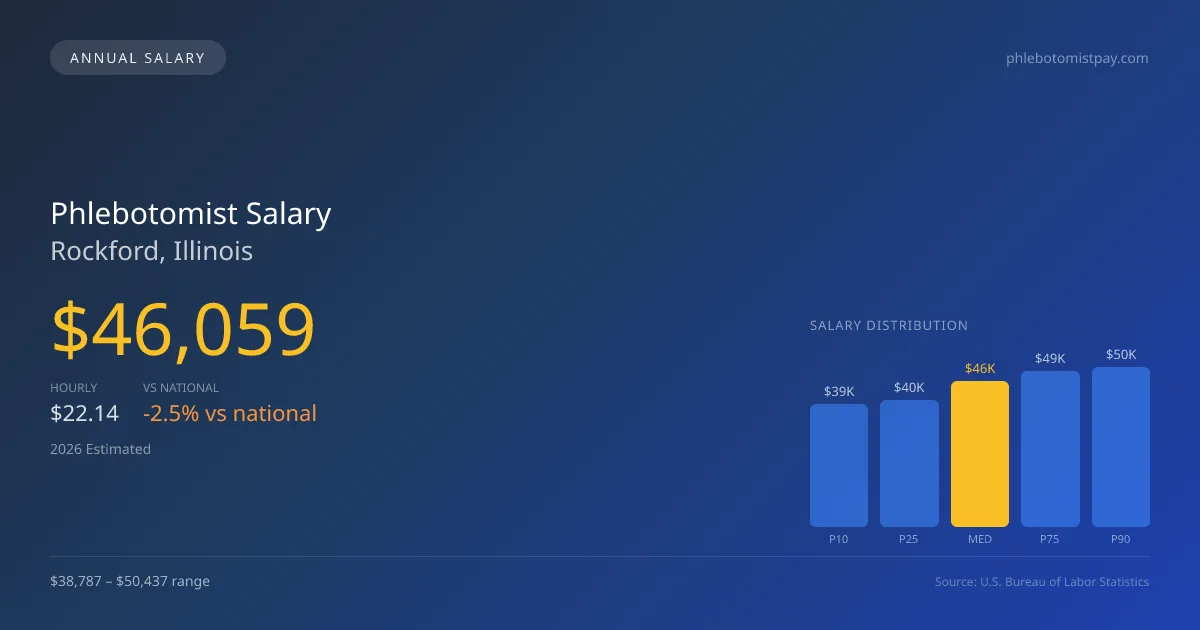
Phlebotomists in Rockford, Illinois can expect a projected median annual salary of $46,059 in 2026, reflecting the region's competitive healthcare market where California CPT licensure is not mandated, allowing for a different pay dynamic. The salary range suggests a broad spectrum of compensation, with the lowest 10% earning approximately $38,787 and the top 90% reaching up to $50,437. These figures are grounded in data derived from 2025 BLS OEWS surveys. As the city continues developing its healthcare services, the demand for phlebotomy professionals is anticipated to grow, enabling potential wage increases driven by the local job market.
Salary Breakdown
| Percentile | Annual | Hourly |
|---|---|---|
| Entry Level (P10) | $38,787 | $18.64 |
| Lower Range (P25) | $40,009 | $19.24 |
| Median (P50)(typical) | $46,059 | $22.14 |
| Upper Range (P75) | $49,319 | $23.71 |
| Top Earners (P90) | $50,437 | $24.25 |
Median Salary Position
2.54% below the national average
2026 Salary Percentile Distribution in Rockford
In Rockford, IL, the phlebotomist salary spread from the 10th to 90th percentile is $11,650 (2026 est.). At $46,059, the local median is 2.54% below the national median of $47,261.
Salary Calculator
At 40 hours/week in Rockford: You'd be above the median
How Rockford Phlebotomist Pay Compares
Rockford median: $46,059/year (2026)
| Compared To | Median Salary | Rockford Pays |
|---|---|---|
| Illinois Average | $46,013 | +0.10% more |
| National Average | $47,261 | -2.54% less |
Phlebotomists in Rockford, IL earn a median of $46,059 per year (2026 est.), which is 2.54% lower than the national median of $47,261 and 0.10% above the Illinois state average of $46,013.
Cost-of-Living Adjusted Salary
Rockford has a cost of living 7.85% below the national average, meaning your salary goes further here.
Adjusted salary = nominal × (100 / CoL index). CoL index: 100 = national average.
Rockford, IL has a cost-of-living index of 92.154 (below the national average of 100). A phlebotomist earning $46,059 nominally has purchasing power equivalent to $49,980 in an average-cost city — an effective 8.51% boost.
Compare Purchasing Power
Select a city to see how your salary compares after cost of living
Select a city above to compare purchasing power
2019 BLS Actual
$32,400
2025 BLS Actual
$44,080
2026 Current Est.
$46,059
2019–2027 Growth
+48.5%
Salary Trajectory for Phlebotomists in Rockford (2019–2027)
2019–2025: actual BLS OEWS data for this metro area. 2026+: CAGR 4.49% projection.
| Year | Annual Salary | Status |
|---|---|---|
| 2019 | $32,400 | Actual |
| 2020 | $35,890 | Actual |
| 2021 | $35,350 | Actual |
| 2022 | $35,030 | Actual |
| 2023 | $45,550 | Actual |
| 2024 | $39,620 | Actual |
| 2025 | $44,080 | Actual |
| 2026(current) | $46,059 | Estimated |
| 2027 | $48,127 | Projected |
Based on 7 years of BLS OEWS data for the Rockford metropolitan area, the median phlebotomist salary grew 36.0% from $32,400 (2019) to $44,080 (2025). At a 4.49% compound annual growth rate, salaries are projected to reach $48,127 by 2027 — a total increase of $15,727 (48.54%) from 2019.
Note: Historical values (2019–2025) are actual BLS OEWS figures for the Rockford metropolitan area, sourced from annual Occupational Employment and Wage Statistics surveys. 2026–2026 figures are current estimates, and 2027 values are projections, calculated using a 4.49% CAGR derived from 7-year BLS historical data. Actual salaries may vary based on employer, experience, certifications, and local market conditions.
Salary by Experience Level
| Experience | Estimated Salary Range |
|---|---|
| 0-2 years (New Graduate) | $38,787 – $40,009 |
| 3-5 years (Mid Career) | $40,009 – $46,059 |
| 5+ years (Experienced) | $46,059 – $49,319 |
| 10+ years (Top Earner) | $49,319 – $50,437 |
PBT salary ranges estimated from BLS percentile data. Individual phlebotomist compensation varies by employer, certifications, and specialization.
Phlebotomist Job Market in Rockford
In Rockford, about 260 phlebotomists are currently employed across various sectors, including hospitals, outpatient labs, and plasma donation centers. Given the local cost-of-living index at 92.154—below the national average—phlebotomists' salaries could provide a reasonable purchasing power, particularly in comparison to urban centers. The highest pay often comes from plasma donation facilities, with starting wages ranging from $20 to $25 per hour, while hospital positions tend to offer slightly lower rates. Factors contributing to pay variability include the work setting, shift differentials, and specialized training. For phlebotomists striving to maximize their earnings in Rockford, considering opportunities in plasma donation centers or pursuing shifts that demand specialized skills can prove beneficial.
More salary data for Rockford, IL:
Frequently Asked Questions
How much do phlebotomists make in Rockford, IL in 2026?
Is Rockford, IL a good place to work as a phlebotomist?
Can phlebotomists make $100K in Rockford?
What is the cost-of-living adjusted phlebotomist salary in Rockford?
How much does a phlebotomist make per hour in Rockford?
Related Pages
Compare Salaries
Career Resources
Nearby Cities in Illinois
Written by Aisha Patel, MLT
Career Analyst
Aisha has over 10 years of experience in clinical laboratory technology. She specializes in blood collection and processing. She works in a large urban hospital.
Methodology & Data Source
Salary figures on this page are 2026 projections based on the Bureau of Labor Statistics Occupational Employment and Wage Statistics (OEWS) survey, May 2026 release. The BLS reported a median annual salary of $44,080 for phlebotomistsin the Rockford metropolitan area. A 4.49% compound annual growth rate (CAGR), calculated from 6-year national BLS wage trends, was applied to project current 2026 compensation. Percentile ranges (P10–P90) represent the full salary distribution across experience levels and practice settings in this market.
Data Sources & Methodology
Source: BLS, OEWS, 7-year dataset (–). Per-city data from annual BLS metropolitan area surveys.
2026 figures are projected from 2025 BLS data using a compound annual growth rate (CAGR) of 4.49%, derived from historical BLS wage trends for phlebotomists (SOC 31-9097).
Compiled and verified by Aisha Patel, MLT, a licensed phlebotomist with 10+ years of clinical experience. · View source data at BLS.gov