Phlebotomist Salary in Hawaii: $54,913 (2026)
Quick Answer:Across Hawaii's 10 metropolitan areas, the average median phlebotomist pay sits at $54,913/year heading into 2026 — a figure projected from 2025 BLS OEWS wage data for SOC 31-9097. Because Hawaii sits at BEA RPP 119.3 (19% above the U.S. baseline), that statewide median translates to roughly $46,029 in nationally-comparable purchasing power. Highest-paying metros: Honolulu ($57,416), Kaneohe ($53,619), Mililani Town ($53,523).
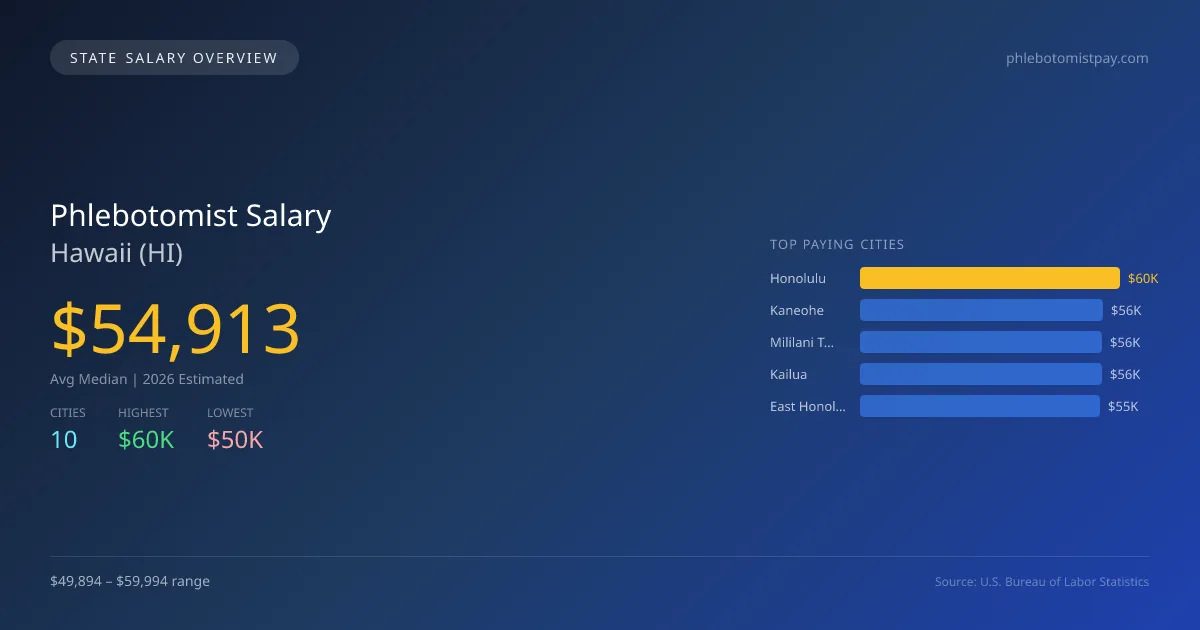
In 2026, the average median salary for phlebotomists in Hawaii is projected to be $54,913, surpassing the national median of $47,261 by 16.2%. Honolulu stands out as the highest-paying city for this profession, with an average salary of $59,994. In contrast, Urban Honolulu offers the lowest at $49,894, reflecting a salary gap of $10,100 between these locations. This difference may be influenced by factors such as cost of living, demand for healthcare services, and local employment opportunities. Phlebotomists in Hawaii are subject to state licensing requirements, which ensure that professionals meet the necessary standards for practice. The demand for phlebotomy services is driven by the state's healthcare needs, bolstered by a projected annual growth rate of 4.49% in the field. Current employment figures indicate that there are 195 phlebotomists in Hawaii, with Honolulu, Kaneohe ($56,026), Mililani Town ($55,926), Kailua ($55,892), and East Honolulu ($55,270) being the top five cities for projected salaries. Overall, the job market for phlebotomists in Hawaii appears stable with positive growth prospects, making it a viable path for those considering a career in the field.
Hawaii Phlebotomist Salary Range
Overall salary range in Hawaii: $41,127 (lowest entry-level) to $78,937 (highest top earner)
Hawaii vs National Average
Hawaii phlebotomists earn 16.19% more than the national median (+$7,652/year difference).
Hawaii Phlebotomist Salary Distribution (2026)
Phlebotomist salaries in Hawaii range from $43,144 (entry-level, 10th percentile) to $66,360 (top earners, 90th percentile), with a median of $54,913. The Hawaii median is $7,652 above the US national median of $47,261. The average hourly rate is $26.40/hr. Approximately 195 phlebotomists are employed across 10 cities.
2019 BLS Actual
$39,710
2025 BLS Actual
$52,553
2026 Current Est.
$54,913
2019–2027 Growth
+44.5%
Salary Trajectory for Phlebotomists in Hawaii (2019–2027)
2019–2025: actual BLS OEWS data for this metro area. 2026+: CAGR 4.49% projection.
| Year | Annual Salary | Status |
|---|---|---|
| 2019 | $39,710 | Actual |
| 2020 | $42,201 | Actual |
| 2021 | $43,432 | Actual |
| 2022 | $41,470 | Actual |
| 2023 | $48,579 | Actual |
| 2024 | $56,184 | Actual |
| 2025 | $52,553 | Actual |
| 2026(current) | $54,913 | Estimated |
| 2027 | $57,378 | Projected |
Based on 7 years of BLS OEWS data for the Hawaii metropolitan area, the median phlebotomist salary grew 32.3% from $39,710 (2019) to $52,553 (2025). At a 4.49% compound annual growth rate, salaries are projected to reach $57,378 by 2027 — a total increase of $17,668 (44.49%) from 2019.
Note: Historical values (2019–2025) are actual BLS OEWS figures for the Hawaii metropolitan area, sourced from annual Occupational Employment and Wage Statistics surveys. 2026–2026 figures are current estimates, and 2027 values are projections, calculated using a 4.49% CAGR derived from 7-year BLS historical data. Actual salaries may vary based on employer, experience, certifications, and local market conditions.
Top 5 Highest Paying Cities in Hawaii
Lowest Paying Cities in Hawaii
| City | Median Salary |
|---|---|
| Urban Honolulu | $49,894 |
| Hilo | $53,502 |
| Kahului | $53,586 |
| Pearl City | $54,724 |
| Waipahu | $55,248 |
Best Value Cities for Phlebotomists in Hawaii
When adjusted for local cost of living, these Hawaii cities offer the most purchasing power for phlebotomists.
| City | Nominal Salary | CoL Index | Adjusted Salary |
|---|---|---|---|
| Honolulu | $59,994 | 119.3 | $50,288 |
| Kaneohe | $56,026 | 119.3 | $46,962 |
| Mililani Town | $55,926 | 119.3 | $46,878 |
| Kailua | $55,892 | 119.3 | $46,850 |
| East Honolulu | $55,270 | 119.3 | $46,329 |
Adjusted salary = nominal salary × (100 / CoL index). CoL index: 100 = national average. Lower index = lower cost of living.
Salary by Experience Level in Hawaii
| Experience Level | Estimated Annual |
|---|---|
| Entry Level (0-2 years) | $43,144 |
| Mid Career (3-7 years) | $54,913 |
| Experienced (7+ years) | $66,360 |
Estimates based on BLS percentile data averaged across Hawaii metro areas. Individual pay varies by employer, certifications, and specialization.
All 10 Cities in Hawaii
| # | City | Median Salary |
|---|---|---|
| 1 | Honolulu | $59,994 |
| 2 | Kaneohe | $56,026 |
| 3 | Mililani Town | $55,926 |
| 4 | Kailua | $55,892 |
| 5 | East Honolulu | $55,270 |
| 6 | Waipahu | $55,248 |
| 7 | Pearl City | $54,724 |
| 8 | Kahului | $53,586 |
| 9 | Hilo | $53,502 |
| 10 | Urban Honolulu | $49,894 |
More Hawaii Salary Data
Senior / Experienced
Top earner salaries for experienced phlebotomists.
Explore More Phlebotomist Salary Data
Frequently Asked Questions
How much do phlebotomists make in Hawaii in 2026?
What is the highest paying city for phlebotomists in Hawaii?
How does Hawaii phlebotomist pay compare to the national average?
What is the entry-level phlebotomist salary in Hawaii?
How many phlebotomists are employed in Hawaii?
Which Hawaii city offers the best value for phlebotomists?
Written by Aisha Patel, MLT
Career Analyst
Aisha has over 10 years of experience in clinical laboratory technology. She specializes in blood collection and processing. She works in a large urban hospital.
Methodology & Data Source
Statewide salary figures on this page are 2026 projections based on the Bureau of Labor Statistics Occupational Employment and Wage Statistics (OEWS) survey, May 2026 release. A 4.49% compound annual growth rate (CAGR), derived from 6-year national BLS wage trends, was applied to each metro area's reported salary to estimate current 2026 phlebotomist compensation across Hawaii. State averages are employment-weighted across 10 metro areas — larger metro areas with more phlebotomistscontribute proportionally more to the average, producing figures that better reflect typical compensation. Individual pay varies by city, employer, certifications, and experience.
Data Sources & Methodology
Source: BLS, OEWS, 4-year dataset (–). Per-city data from annual BLS metropolitan area surveys.
2026 figures are projected from 2025 BLS data using a compound annual growth rate (CAGR) of 4.49%, derived from historical BLS wage trends for phlebotomists (SOC 31-9097).
Compiled and verified by Aisha Patel, MLT, a licensed phlebotomist with 10+ years of clinical experience. · View source data at BLS.gov