Phlebotomist Salary in Georgia: $47,629 (2026)
Quick Answer:Across Georgia's 40 metropolitan areas, the average median phlebotomist pay sits at $47,629/year heading into 2026 — a figure projected from 2025 BLS OEWS wage data for SOC 31-9097. Because Georgia sits at BEA RPP 93.1 (7% below the U.S. baseline), that statewide median translates to roughly $51,159 in nationally-comparable purchasing power. Highest-paying metros: Sandy Springs ($50,336), Atlanta ($49,370), Roswell ($48,250).
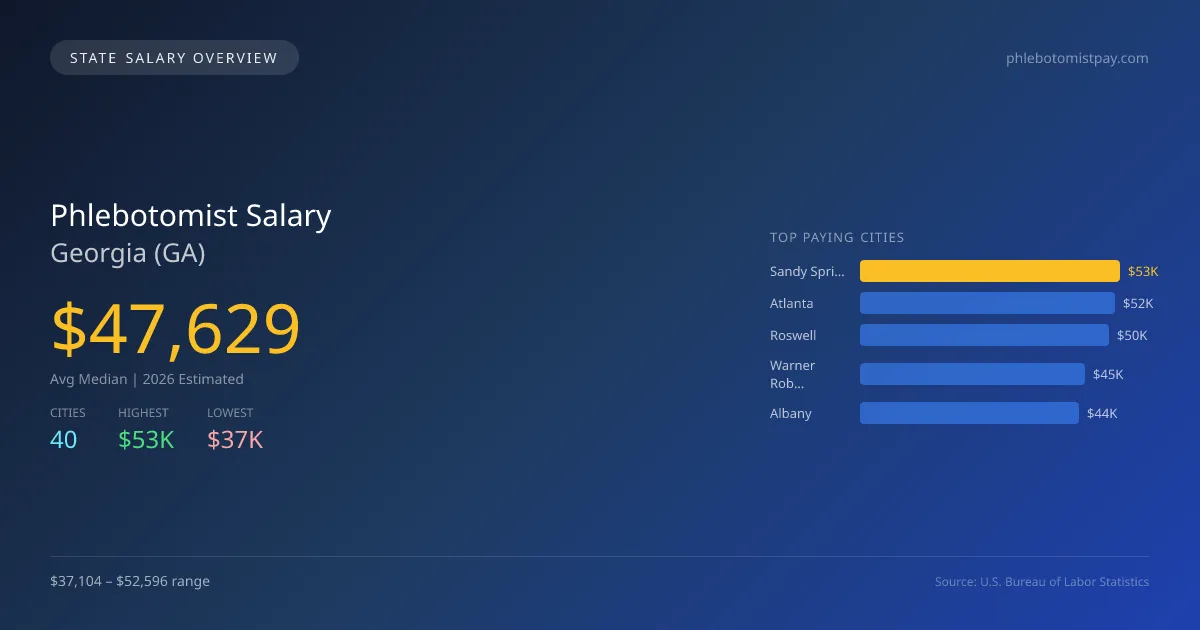
The average median salary for phlebotomists in Georgia in 2026 is projected to be $47,629, slightly above the national median of $47,261, representing a 0.8% difference. There is a significant salary variation across the state, with Sandy Springs offering the highest average salary at $52,596, while Valdosta presents the lowest at $37,104. This disparity can be attributed to factors such as cost of living, local demand for healthcare services, and the concentration of medical facilities in urban areas compared to more rural settings. In Georgia, phlebotomists must meet state licensing requirements and adhere to specific scope of practice laws, which can influence employment opportunities and salaries. The state is experiencing a positive job market for this role, with a projected annual growth rate of 4.49% in phlebotomy positions. Top cities for employment in 2026 include Atlanta at $51,587, Roswell at $50,416, and Warner Robins at $45,443, reflecting strong demand in metropolitan areas. Overall, the job outlook for phlebotomists in Georgia is favorable, supported by ongoing needs in the healthcare sector and the expansion of diagnostic services.
Georgia Phlebotomist Salary Range
Overall salary range in Georgia: $31,002 (lowest entry-level) to $67,750 (highest top earner)
Georgia vs National Average
Georgia phlebotomists earn 0.78% more than the national median (+$368/year difference).
Georgia Phlebotomist Salary Distribution (2026)
Phlebotomist salaries in Georgia range from $36,788 (entry-level, 10th percentile) to $56,907 (top earners, 90th percentile), with a median of $47,629. The Georgia median is $368 above the US national median of $47,261. The average hourly rate is $22.89/hr. Approximately 4,623 phlebotomists are employed across 40 cities.
2019 BLS Actual
$32,661
2025 BLS Actual
$45,582
2026 Current Est.
$47,629
2019–2027 Growth
+52.4%
Salary Trajectory for Phlebotomists in Georgia (2019–2027)
2019–2025: actual BLS OEWS data for this metro area. 2026+: CAGR 4.49% projection.
| Year | Annual Salary | Status |
|---|---|---|
| 2019 | $32,661 | Actual |
| 2020 | $34,593 | Actual |
| 2021 | $36,565 | Actual |
| 2022 | $38,804 | Actual |
| 2023 | $42,396 | Actual |
| 2024 | $42,993 | Actual |
| 2025 | $45,582 | Actual |
| 2026(current) | $47,629 | Estimated |
| 2027 | $49,768 | Projected |
Based on 7 years of BLS OEWS data for the Georgia metropolitan area, the median phlebotomist salary grew 39.6% from $32,661 (2019) to $45,582 (2025). At a 4.49% compound annual growth rate, salaries are projected to reach $49,768 by 2027 — a total increase of $17,107 (52.38%) from 2019.
Note: Historical values (2019–2025) are actual BLS OEWS figures for the Georgia metropolitan area, sourced from annual Occupational Employment and Wage Statistics surveys. 2026–2026 figures are current estimates, and 2027 values are projections, calculated using a 4.49% CAGR derived from 7-year BLS historical data. Actual salaries may vary based on employer, experience, certifications, and local market conditions.
Top 5 Highest Paying Cities in Georgia
Lowest Paying Cities in Georgia
Best Value Cities for Phlebotomists in Georgia
When adjusted for local cost of living, these Georgia cities offer the most purchasing power for phlebotomists.
| City | Nominal Salary | CoL Index | Adjusted Salary |
|---|---|---|---|
| Sandy Springs | $52,596 | 93.1 | $56,494 |
| Roswell | $50,416 | 93.1 | $54,153 |
| Atlanta | $51,587 | 100.058 | $51,557 |
| Albany | $44,241 | 87.669 | $50,464 |
| Warner Robins | $45,443 | 93.789 | $48,452 |
Adjusted salary = nominal salary × (100 / CoL index). CoL index: 100 = national average. Lower index = lower cost of living.
Salary by Experience Level in Georgia
| Experience Level | Estimated Annual |
|---|---|
| Entry Level (0-2 years) | $36,788 |
| Mid Career (3-7 years) | $47,629 |
| Experienced (7+ years) | $56,907 |
Estimates based on BLS percentile data averaged across Georgia metro areas. Individual pay varies by employer, certifications, and specialization.
All 40 Cities in Georgia
| # | City | Median Salary |
|---|---|---|
| 1 | Sandy Springs | $52,596 |
| 2 | Atlanta | $51,587 |
| 3 | Roswell | $50,416 |
| 4 | Warner Robins | $45,443 |
| 5 | Albany | $44,241 |
| 6 | Savannah | $43,039 |
| 7 | Alpharetta | $42,094 |
| 8 | South Fulton | $42,046 |
| 9 | Columbus | $42,005 |
| 10 | Augusta | $41,671 |
| 11 | Rome | $41,671 |
| 12 | Brookhaven | $41,669 |
| 13 | Macon | $41,577 |
| 14 | Lawrenceville | $41,379 |
| 15 | Statesboro | $41,334 |
| 16 | Woodstock | $41,285 |
| 17 | Stockbridge | $41,224 |
| 18 | Pooler | $41,166 |
| 19 | Marietta | $40,912 |
| 20 | Peachtree Corners | $40,907 |
| 21 | Johns Creek | $40,731 |
| 22 | Hinesville | $40,499 |
| 23 | Evans | $40,419 |
| 24 | Douglasville | $40,380 |
| 25 | Dunwoody | $40,378 |
| 26 | Gainesville | $40,364 |
| 27 | Smyrna | $40,335 |
| 28 | Athens | $40,302 |
| 29 | McDonough | $40,164 |
| 30 | Newnan | $40,099 |
| 31 | Milton | $40,082 |
| 32 | Kennesaw | $39,781 |
| 33 | Cartersville | $39,693 |
| 34 | Peachtree City | $39,692 |
| 35 | Tucker | $39,591 |
| 36 | Canton | $39,497 |
| 37 | Dalton | $38,933 |
| 38 | Griffin | $38,762 |
| 39 | Brunswick | $38,755 |
| 40 | Valdosta | $37,104 |
More Georgia Salary Data
Senior / Experienced
Top earner salaries for experienced phlebotomists.
Compare Cities in Georgia
View all comparisons →Explore More Phlebotomist Salary Data
Frequently Asked Questions
How much do phlebotomists make in Georgia in 2026?
What is the highest paying city for phlebotomists in Georgia?
How does Georgia phlebotomist pay compare to the national average?
What is the entry-level phlebotomist salary in Georgia?
How many phlebotomists are employed in Georgia?
Which Georgia city offers the best value for phlebotomists?
Written by Aisha Patel, MLT
Career Analyst
Aisha has over 10 years of experience in clinical laboratory technology. She specializes in blood collection and processing. She works in a large urban hospital.
Methodology & Data Source
Statewide salary figures on this page are 2026 projections based on the Bureau of Labor Statistics Occupational Employment and Wage Statistics (OEWS) survey, May 2026 release. A 4.49% compound annual growth rate (CAGR), derived from 6-year national BLS wage trends, was applied to each metro area's reported salary to estimate current 2026 phlebotomist compensation across Georgia. State averages are employment-weighted across 40 metro areas — larger metro areas with more phlebotomistscontribute proportionally more to the average, producing figures that better reflect typical compensation. Individual pay varies by city, employer, certifications, and experience.
Data Sources & Methodology
Source: BLS, OEWS, 7-year dataset (–). Per-city data from annual BLS metropolitan area surveys.
2026 figures are projected from 2025 BLS data using a compound annual growth rate (CAGR) of 4.49%, derived from historical BLS wage trends for phlebotomists (SOC 31-9097).
Compiled and verified by Aisha Patel, MLT, a licensed phlebotomist with 10+ years of clinical experience. · View source data at BLS.gov