Phlebotomist Salary in Ontario, CA: $54,527 (2026)
Quick Answer:A full-time phlebotomist in Ontario, CA earns a median $54,527/year (≈ $26.22/hour) in nominal terms for 2026 — projected from BLS OEWS 2025 (SOC 31-9097). Once you factor in Ontario's price level (13% above national, BEA RPP 113.1), that paycheck buys what $48,211 would nationally. Nominal pay sits 2.6% below the California state average.
Based on BLS state-level estimates · View source
Phlebotomist salaries in Ontario, CA, paint a promising picture for those entering the field, with a median annual pay projected at $54,527 in 2026. This figure illustrates a competitive landscape, particularly when juxtaposed with national averages, highlighting a 15.37% increase over the national median, which sits at $47,261. Phlebotomists in Ontario can expect their annual salaries to fall within a broad range, from a lower tenth percentile at $41,498 to an upper ninetieth percentile of $71,732. Such local estimates are shaped by BLS state-level data and regional cost adjustments, reflecting not just the demand for skilled practitioners but also the area's economic conditions. The job market for phlebotomists in Ontario is robust, with an increasing number of positions available due to the need for healthcare services.
About the Ontario Market
Salary estimated from California average ($52,000) adjusted for local cost of living.
Salary Breakdown
| Percentile | Annual | Hourly |
|---|---|---|
| Entry Level (P10) | $41,498 | $19.95 |
| Lower Range (P25) | $44,584 | $21.43 |
| Median (P50)(typical) | $54,527 | $26.22 |
| Upper Range (P75) | $59,492 | $28.60 |
| Top Earners (P90) | $71,732 | $34.48 |
Median Salary Position
15.37% above the national average
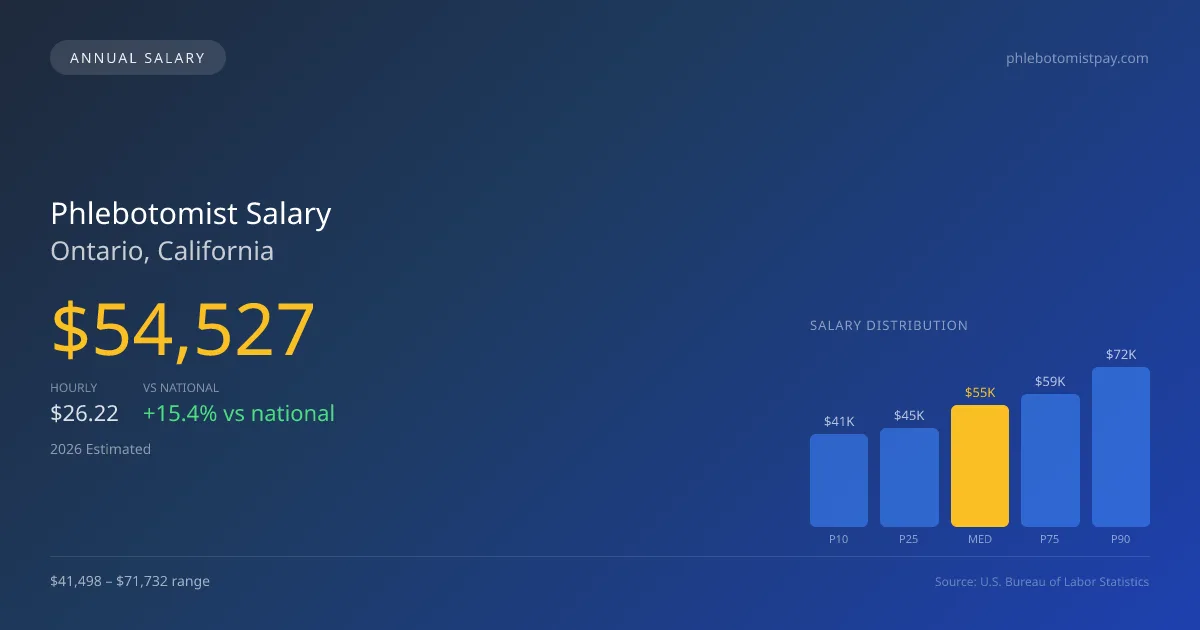
2026 Salary Percentile Distribution in Ontario
In Ontario, CA, the phlebotomist salary spread from the 10th to 90th percentile is $30,234 (2026 est.). At $54,527, the local median is 15.37% above the national median of $47,261.
Salary Calculator
At 40 hours/week in Ontario: You'd be in the lower-middle range
How Ontario Phlebotomist Pay Compares
Ontario median: $54,527/year (2026)
| Compared To | Median Salary | Ontario Pays |
|---|---|---|
| California Average | $55,983 | -2.60% less |
| National Average | $47,261 | +15.37% more |
Phlebotomists in Ontario, CA earn a median of $54,527 per year (2026 est.), which is 15.37% higher than the national median of $47,261 and 2.60% below the California state average of $55,983.
Cost-of-Living Adjusted Salary
Ontario has a cost of living 13.10% above the national average.
Adjusted salary = nominal × (100 / CoL index). CoL index: 100 = national average.
Ontario, CA has a cost-of-living index of 113.1 (above the national average of 100). While the nominal salary of $54,527 is competitive, the higher cost of living reduces purchasing power to an effective $48,211 — a 11.58% reduction.
Compare Purchasing Power
Select a city to see how your salary compares after cost of living
Select a city above to compare purchasing power
2019 BLS Actual
$40,970
2025 BLS Actual
$52,184
2026 Current Est.
$54,527
2019–2027 Growth
+39.1%
Salary Trajectory for Phlebotomists in Ontario (2019–2027)
2019–2025: actual BLS OEWS data for this metro area. 2026+: CAGR 4.49% projection.
| Year | Annual Salary | Status |
|---|---|---|
| 2019 | $40,970 | Actual |
| 2020 | $41,904 | Actual |
| 2021 | $43,127 | Actual |
| 2022 | $44,454 | Actual |
| 2023 | $48,238 | Actual |
| 2024 | $60,201 | Actual |
| 2025 | $52,184 | Actual |
| 2026(current) | $54,527 | Estimated |
| 2027 | $56,975 | Projected |
Based on 7 years of BLS OEWS data for the Ontario metropolitan area, the median phlebotomist salary grew 27.4% from $40,970 (2019) to $52,184 (2025). At a 4.49% compound annual growth rate, salaries are projected to reach $56,975 by 2027 — a total increase of $16,005 (39.07%) from 2019.
Note: Historical values (2019–2025) are actual BLS OEWS figures for the Ontario metropolitan area, sourced from annual Occupational Employment and Wage Statistics surveys. 2026–2026 figures are current estimates, and 2027 values are projections, calculated using a 4.49% CAGR derived from 7-year BLS historical data. Actual salaries may vary based on employer, experience, certifications, and local market conditions.
Salary by Experience Level
| Experience | Estimated Salary Range |
|---|---|
| 0-2 years (New Graduate) | $41,498 – $44,584 |
| 3-5 years (Mid Career) | $44,584 – $54,527 |
| 5+ years (Experienced) | $54,527 – $59,492 |
| 10+ years (Top Earner) | $59,492 – $71,732 |
PBT salary ranges estimated from BLS percentile data. Individual phlebotomist compensation varies by employer, certifications, and specialization.
Phlebotomist Job Market in Ontario
In Ontario, the local workforce comprises 42 employed phlebotomists, and they must navigate a cost of living index pegged at 113.1, which exceeds the national average. This elevated index impacts the take-home purchasing power for phlebotomists, as expenses in the area can stretch their salaries. Employers that offer the highest pay in Ontario typically include plasma donation centers, where starting wages can range from $20 to $25 per hour, effectively outpacing many hospital and outpatient lab roles. Other well-paying settings include reference labs and blood centers, which also pay a premium for specialty skills such as pediatric draw techniques. Factors influencing the salary spectrum include shift differentials for early morning hospital draws, state CPT licensure, and varying workplace environments. For phlebotomists aiming to maximize pay, securing certification through organizations such as ASCP or NHA and seeking employment at plasma donation facilities could yield significant benefits in the competitive Ontario market.
More salary data for Ontario, CA:
Frequently Asked Questions
How much do phlebotomists make in Ontario, CA in 2026?
Is Ontario, CA a good place to work as a phlebotomist?
Can phlebotomists make $100K in Ontario?
What is the cost-of-living adjusted phlebotomist salary in Ontario?
How much does a phlebotomist make per hour in Ontario?
Related Pages
Compare Salaries
Career Resources
Nearby Cities in California
Written by Aisha Patel, MLT
Career Analyst
Aisha has over 10 years of experience in clinical laboratory technology. She specializes in blood collection and processing. She works in a large urban hospital.
Methodology & Data Source
Salary figures on this page are 2026 projections based on the Bureau of Labor Statistics Occupational Employment and Wage Statistics (OEWS) survey, May 2026 release. The BLS reported a median annual salary of $52,184 for phlebotomistsin the Ontario metropolitan area. A 4.49% compound annual growth rate (CAGR), calculated from 6-year national BLS wage trends, was applied to project current 2026 compensation. Percentile ranges (P10–P90) represent the full salary distribution across experience levels and practice settings in this market.
Data Sources & Methodology
Salary data for Ontario is estimated from official BLS state-level occupational wage data (2025), adjusted for regional cost-of-living differences using BEA RPP (Regional Price Parities).
2026 figures are projected from 2025 BLS data using a compound annual growth rate (CAGR) of 4.49%, derived from historical BLS wage trends for phlebotomists (SOC 31-9097).
Compiled and verified by Aisha Patel, MLT, a licensed phlebotomist with 10+ years of clinical experience. · View source data at BLS.gov