Phlebotomist Salary in Lynwood, CA: $54,020 (2026)
Quick Answer:A full-time phlebotomist in Lynwood, CA earns a median $54,020/year (≈ $25.98/hour) in nominal terms for 2026 — projected from BLS OEWS 2025 (SOC 31-9097). Once you factor in Lynwood's price level (13% above national, BEA RPP 113.1), that paycheck buys what $47,763 would nationally. Nominal pay sits 3.5% below the California state average.
Based on BLS state-level estimates · View source
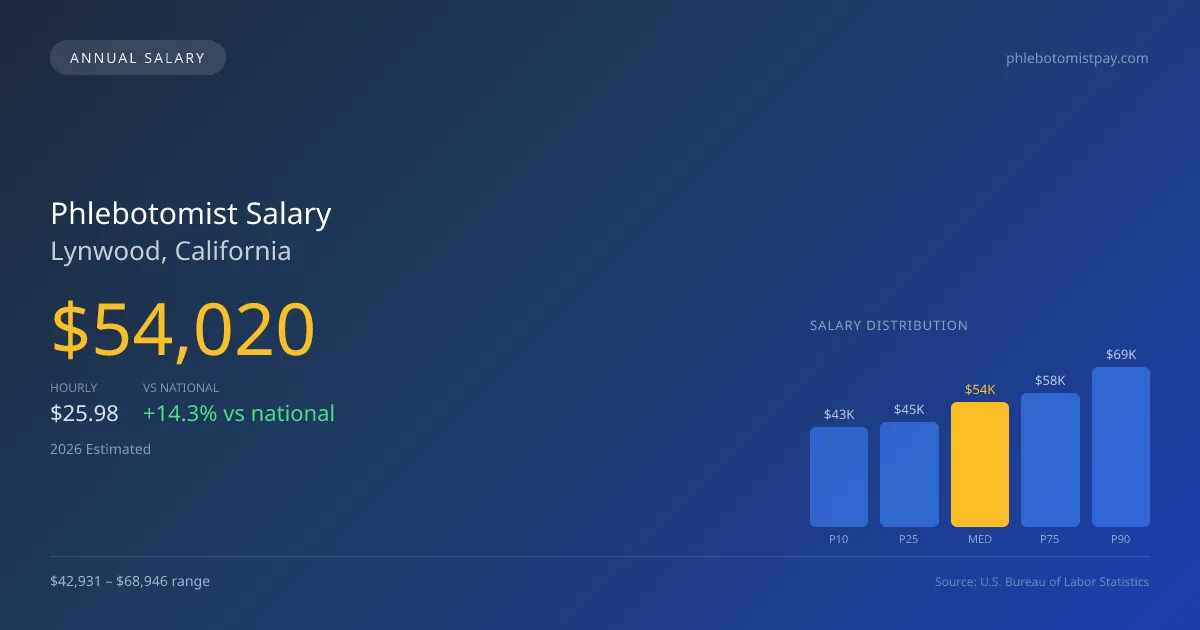
The phlebotomist salary in Lynwood, CA, is projected to reach a median annual income of $54,020 in 2026, which reflects a notable premium of 14.30% over the national median of $47,261. The salary range for phlebotomists in this area extends from $42,931 at the P10 level to $68,946 at the P90 mark. These figures, derived from 2025 BLS data and adjusted for regional cost factors, highlight the competitive nature of the local job market. Given the concentration of healthcare facilities nearby that offer various stipends for early morning hospital draws, phlebotomists can maximize earnings in Lynwood, where demand for skilled professionals continues to grow.
About the Lynwood Market
Salary estimated from California average ($52,000) adjusted for local cost of living.
Salary Breakdown
| Percentile | Annual | Hourly |
|---|---|---|
| Entry Level (P10) | $42,931 | $20.64 |
| Lower Range (P25) | $45,355 | $21.81 |
| Median (P50)(typical) | $54,020 | $25.98 |
| Upper Range (P75) | $57,923 | $27.85 |
| Top Earners (P90) | $68,946 | $33.14 |
Median Salary Position
14.30% above the national average
2026 Salary Percentile Distribution in Lynwood
In Lynwood, CA, the phlebotomist salary spread from the 10th to 90th percentile is $26,015 (2026 est.). At $54,020, the local median is 14.3% above the national median of $47,261.
Salary Calculator
At 40 hours/week in Lynwood: You'd be in the lower-middle range
How Lynwood Phlebotomist Pay Compares
Lynwood median: $54,020/year (2026)
| Compared To | Median Salary | Lynwood Pays |
|---|---|---|
| California Average | $55,980 | -3.50% less |
| National Average | $47,261 | +14.30% more |
Phlebotomists in Lynwood, CA earn a median of $54,020 per year (2026 est.), which is 14.30% higher than the national median of $47,261 and 3.50% below the California state average of $55,980.
Cost-of-Living Adjusted Salary
Lynwood has a cost of living 13.10% above the national average.
Adjusted salary = nominal × (100 / CoL index). CoL index: 100 = national average.
Lynwood, CA has a cost-of-living index of 113.1 (above the national average of 100). While the nominal salary of $54,020 is competitive, the higher cost of living reduces purchasing power to an effective $47,763 — a 11.58% reduction.
Compare Purchasing Power
Select a city to see how your salary compares after cost of living
Select a city above to compare purchasing power
2019 BLS Actual
$40,589
2025 BLS Actual
$51,699
2026 Current Est.
$54,020
2019–2027 Growth
+39.1%
Salary Trajectory for Phlebotomists in Lynwood (2019–2027)
2019–2025: actual BLS OEWS data for this metro area. 2026+: CAGR 4.49% projection.
| Year | Annual Salary | Status |
|---|---|---|
| 2019 | $40,589 | Actual |
| 2020 | $41,515 | Actual |
| 2021 | $42,726 | Actual |
| 2022 | $44,041 | Actual |
| 2023 | $47,790 | Actual |
| 2024 | $56,768 | Actual |
| 2025 | $51,699 | Actual |
| 2026(current) | $54,020 | Estimated |
| 2027 | $56,446 | Projected |
Based on 7 years of BLS OEWS data for the Lynwood metropolitan area, the median phlebotomist salary grew 27.4% from $40,589 (2019) to $51,699 (2025). At a 4.49% compound annual growth rate, salaries are projected to reach $56,446 by 2027 — a total increase of $15,857 (39.07%) from 2019.
Note: Historical values (2019–2025) are actual BLS OEWS figures for the Lynwood metropolitan area, sourced from annual Occupational Employment and Wage Statistics surveys. 2026–2026 figures are current estimates, and 2027 values are projections, calculated using a 4.49% CAGR derived from 7-year BLS historical data. Actual salaries may vary based on employer, experience, certifications, and local market conditions.
Salary by Experience Level
| Experience | Estimated Salary Range |
|---|---|
| 0-2 years (New Graduate) | $42,931 – $45,355 |
| 3-5 years (Mid Career) | $45,355 – $54,020 |
| 5+ years (Experienced) | $54,020 – $57,923 |
| 10+ years (Top Earner) | $57,923 – $68,946 |
PBT salary ranges estimated from BLS percentile data. Individual phlebotomist compensation varies by employer, certifications, and specialization.
Phlebotomist Job Market in Lynwood
In Lynwood, a total of 16 phlebotomists are currently employed, indicating a steady presence of professionals in the field. The cost-of-living index in the area is 113.1, positioning Lynwood above the national average, which may affect overall purchasing power. Employers in the local job market include hospitals, outpatient lab patient service centers like Quest and LabCorp, and plasma donation centers such as Grifols and CSL Plasma, which typically offer higher pay due to their specialized nature. Factors like shift differentials for hospital draws and the complexity of pediatric draws can drive variance in compensation. With California's requirements for Certified Phlebotomy Technician licensure further enhancing the ability to negotiate higher pay, seeking positions in plasma donation or specialized healthcare settings could yield the best returns for phlebotomists in Lynwood.
More salary data for Lynwood, CA:
Frequently Asked Questions
How much do phlebotomists make in Lynwood, CA in 2026?
Is Lynwood, CA a good place to work as a phlebotomist?
Can phlebotomists make $100K in Lynwood?
What is the cost-of-living adjusted phlebotomist salary in Lynwood?
How much does a phlebotomist make per hour in Lynwood?
Related Pages
Compare Salaries
Career Resources
Nearby Cities in California
Written by Aisha Patel, MLT
Career Analyst
Aisha has over 10 years of experience in clinical laboratory technology. She specializes in blood collection and processing. She works in a large urban hospital.
Methodology & Data Source
Salary figures on this page are 2026 projections based on the Bureau of Labor Statistics Occupational Employment and Wage Statistics (OEWS) survey, May 2026 release. The BLS reported a median annual salary of $51,699 for phlebotomistsin the Lynwood metropolitan area. A 4.49% compound annual growth rate (CAGR), calculated from 6-year national BLS wage trends, was applied to project current 2026 compensation. Percentile ranges (P10–P90) represent the full salary distribution across experience levels and practice settings in this market.
Data Sources & Methodology
Salary data for Lynwood is estimated from official BLS state-level occupational wage data (2025), adjusted for regional cost-of-living differences using BEA RPP (Regional Price Parities).
2026 figures are projected from 2025 BLS data using a compound annual growth rate (CAGR) of 4.49%, derived from historical BLS wage trends for phlebotomists (SOC 31-9097).
Compiled and verified by Aisha Patel, MLT, a licensed phlebotomist with 10+ years of clinical experience. · View source data at BLS.gov